The hexmapApp() application provides an interactive interface for discovering USGS subwatersheds, isolating specific geographic features (such as island landmasses), and projecting spatial hexagonal substrate networks for quantitative population ethology simulations.
Interactive Application Usage
You can launch the interactive application natively in R:
[!NOTE] Live Deployment: The interactive application requires dynamic spatial intersection libraries (sf) and live USGS / OpenStreetMap API access. It is deployed live on Posit Connect (HexMap).
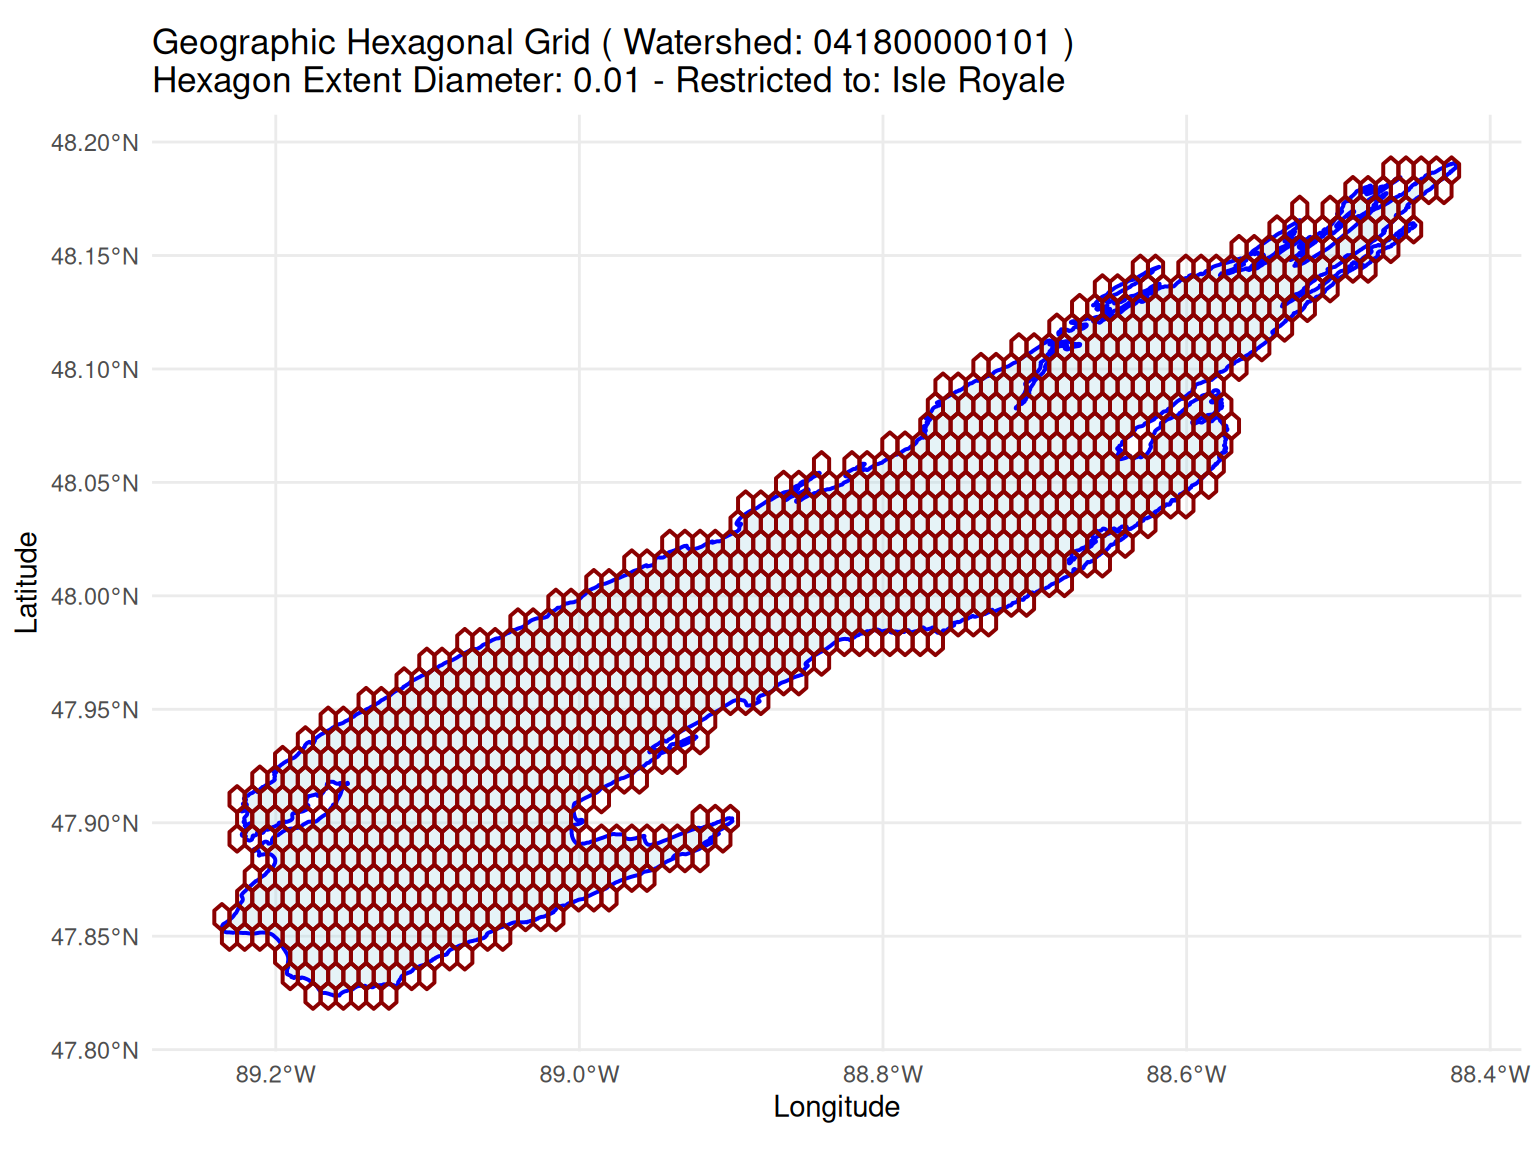
Below is an example showing how get_watershed() retrieves the USGS HUC12 subwatershed boundary (041800000101), clips it to the Isle Royale landmass using OpenStreetMap nominatim geometry (when osmdata is available), and overlays a spatial hexagonal grid (add_watershed_hex_overlay).
library(ewing)library(ggplot2)# Check if osmdata is installed for feature boundary restrictionfeat_name <-if (requireNamespace("osmdata", quietly =TRUE)) "Isle Royale"elseNULL# 1. Fetch HUC12 boundary (optionally restricted to Isle Royale island landmass)huc_info <-get_watershed("041800000101", feature_name = feat_name)# 2. Construct spatial hexagonal overlay mesh (diameter = 0.01 degrees)hex_obj <-add_watershed_hex_overlay(huc_info, hex_diameter =0.01)# 3. Visualize using autoplotggplot2::autoplot(hex_obj)
Technical Features
Leaflet Spatial Discovery: Click any location on North America or search landmark strings to reverse-geocode coordinates into USGS HUC12 subwatershed IDs (get_huc_from_point).
Feature Isolation: Clip large HUC boundaries covering open water to target landmasses (e.g. Isle Royale) using osmdata::getbb().